Corporate Real Estate Analysis
Sample Project
Context
The company (anonymized), a global industrial leader with locations worldwide, has a real estate department dedicated to optimizing its extensive property portfolio. This includes managing both leased and owned properties, with a focus on reducing costs through employee relocations, terminating expensive leases, and strategically buying or selling properties. To effectively manage this portfolio, the company relies on a SaaS solution.
Project Goal
The objective of this project was to create an automated Power BI report that would provide the real estate team with all the necessary KPIs and data to make informed decisions. This report would serve as a critical tool in their efforts to streamline costs and enhance the efficiency of the real estate portfolio.
My Contribution
1. Scoping and Requirement Gathering
Throughout the project, I collaborated closely with key stakeholders, including the Real Estate team, IT team, and the SaaS provider, to thoroughly understand the project requirements, data sources, and timelines.
Documentation produced
- Prioritized List of KPIs
I developed a prioritized list of key performance indicators (KPIs) to be included in the Power BI report, based on discussions and analyses with stakeholders. This document served as a blueprint for the report’s development, ensuring that the most critical data points were highlighted and easily accessible to the team
- Data Sources Identification
I defined the required dimensions and data sources for the report, using a Kimball matrix to organize the KPIs across relevant categories, timeframes, and other key dimensions.
- Report UI Mockup

I also created a mockup of the report's user interface to illustrate the design and layout, helping stakeholders visualize the final product.
2. Development
I adopted an iterative approach to development, allowing for quick feedback from stakeholders, ensuring alignment with project goals, and enabling adjustments as needed.
2.1) Data Connection
Identified required data sources and connection methods, including:
- SharePoint List
- Saas Provider OData API
2.2) Data Cleaning and transformation
Used Power Query to clean and transform the data, including adding new columns to prepare a star schema model.
2.3) Data Model
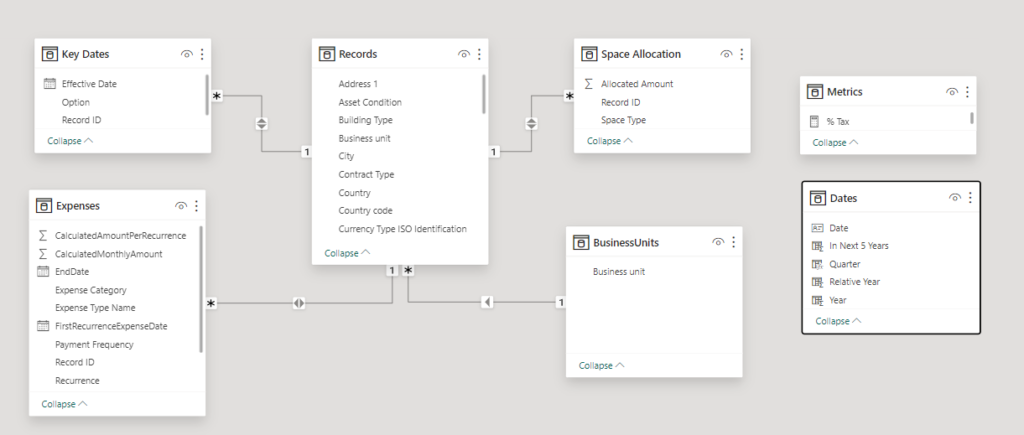
- Adopted a star schema model
- I separated the Date Table to enable multiple date columns filtering.
2.4) Measures
Created helper measures, such as the one below, using the TREATAS expression to establish custom relationships between the a date field in the fact table and the date table.
Records Expiration Date = CALCULATE(
    DISTINCTCOUNTNOBLANK('Key Dates'[Record ID]),
    TREATAS(VALUES(Dates[Date]), 'Key Dates'[Effective Date]),
    'Key Dates'[Option] = "Expiration"
)
3) Security
- Implemented Row-Level Security (RLS) based on users' Business Units to ensure data security and appropriate access control.
4) Deployment
- Set up an automated data refresh every hour
- Established a deployment pipeline for continuous integration and delivery of the report
Conclusion
This project successfully delivered an automated Power BI report that now provides the real estate team with real-time access to critical KPIs and insights. The report has become an indispensable tool in optimizing the company’s global real estate portfolio, enabling more informed decision-making, and driving significant cost savings. The iterative development process, combined with close collaboration with stakeholders, ensured that the final product met the team's needs and contributed to more efficient portfolio management.


Marcus Donovan
Senior Data Analyst, founder of DataClub